
 Under the desert in eastern Saudi Arabia lies Ghawar, the largest oil field in the world. It has been famously productive, with a per-well flow rate of thousands of barrels per day, owing to a combination of efficient water injection, good rock permeability, and other factors. At its best, it set the standard for easy oil. The first wells were drilled with rather rudimentary equipment hauled across the desert sands, and the oil would flow out at ten thousand barrels per day. It was, in a sense, a giant udder. And the world milked it hard for awhile.
However, this article isn't just about a metaphor; it is also about cows, the Holsteins of Haradh. But in the end, I will circle back to the present and future of Saudi oil production.
In my Google Earth-enabled virtual travels around Saudi Arabia looking for oil wells and such, I have come upon many strange sights. Some of these are of natural origin yet can only be appreciated from a satellite's perspective, as is the case for this tidal pool located near a gas oil separation plant for the Safaniya oil field:
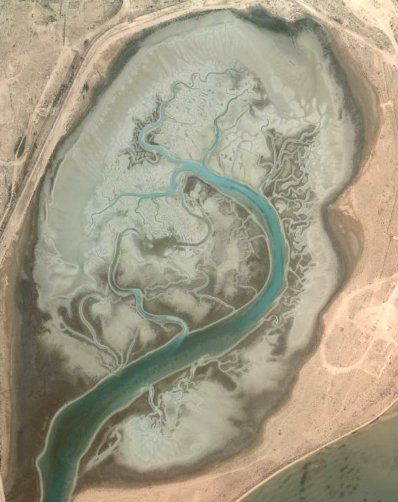 | ||
| Figure 1. My favorite Google Earth view, near Safaniyah oil field, Saudi Arabia |
There are many crop circles scattered about eastern Saudi Arabia -- by which I mean circles of crops watered by central pivot irrigation (as opposed to circles of crops flattened by aliens). A line of such circles cuts across the southern tip of the Ghawar field, seemingly following the course of a dry river bed.
 | ||
| Figure 2. Irrigation along the southern fringe of the Ghawar Oil Field, Saudi Arabia. Arrows indicate location of features of interest. |
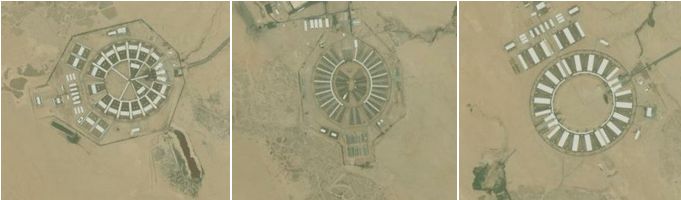 | ||
| Figure 3. Symmetrical objects of interest near Ghawar oil field. |
Each of these is about 250 meters in radius. It took me awhile to discover what these were, as at the time, crowdsourced mapping was just getting started. It so happens that they are part of a huge integrated dairy operation, one of the largest in the world. Fodder crops are grown in nearby circles, cows are milked with state of the art equipment, and the milk is packaged and/or processed into cheese and other products before being shipped. All of this happens in the northernmost fringe of the Rub' al Khali desert, one of the most inhospitable places on earth. Start here to browse around Saudi Arabia's Dairyland on your own using Google Maps.
Turning Black Gold Into White Milk
Here is a glossy PR video describing the operations:Although the original intent was to locally breed cows more suited to the Saudi climate, it seems they had to import them. Here is another video describing the transport of cows from Australia. A bit different than a Texas cattle drive.
They Built It, But They Didn't Come
Answering why and how these dairy farms came to be located here reveals some interesting history of Saudi Arabia. Although great wealth of the country results from its abundant store of fossil fuels, the necessity of diversifying the economy has long been recognized. The lack of food security was always a big concern. In addition, there remained the nagging problem of what to do with the Bedouins, nomadic peoples who resisted efforts to be integrated into the broader Saudi society. And since they now had it in abundance, they decided to throw money at the problems. What could go wrong?As related in the book "Inside the Mirage" by Thomas Lippman, a problem with Saudi agriculture is that most of the private land was owned by just a few people, and they were wealthy aristocrats, not farmers, and there wasn't much local knowledge of modern large-scale agriculture in any case. One of the proposed solutions was to create huge demonstration projects by which modern techniques of farming could be learned and applied. As for labor, the goal was to provide individual farms, housing, and modern conveniences to the Bedouin, who would settle down for a life on the farm. The largest such project was the al-Faysal Settlement Project at Haradh, designed for 1000 families. It didn't work out as planned, though, because the Bedouins never came:
You know of the Haradh project, where $20 million was spent irrigating a spot in the desert where an aquifer was found not too far from the surface. This project took six years to complete and was done for the purpose of settling Bedouin tribes. At the end of six years, no Bedouin turned up and the government had to consider how to use the most modern desert irrigation facility in the world.Eventually, the Saudi government partnered with Masstock, a Dublin-based industrialized endeavor run by two brothers. The Haradh project became the largest of their operations in Saudi Arabia at the time. Eventually, a new company called Almarai (Arabic for "pasture") was created which involved Prince Sultan bin Mohammed bin Saud Al Kabeer. In 1981, a royal decree created the National Agricultural Development Company (NADEC) for the purpose of furthering agricultural independence, and (for reasons I haven't discerned), NADEC gained control of the Haradh project. Almarai went on the become the largest vertically integrated dairy company in the world, and Al Kabeer is a hidden billionaire.
(From a 1974 Ford Foundation memo)
As a side note, NADEC sued Saudi Aramco a few years ago as a result of the latter using some NADEC property for Haradh oil operations, and a lower court ordered Saudi Aramco to vacate. The web links to those reports have disappeared, and one wonders how the appeal went. Separately, NADEC has reportedly obtained farmland in Sudan. Food security.
Speaking of Cash Cows
A half decade ago, much of The Oil Drum's focus was on possible problems with Saudi Arabian oil production. Was the flow from Ghawar tanking? Were all of their older fields well past their prime, and were their future options as limited as Matt Simmons suggested in Twilight in the Desert? My analyses and those of others here seem to suggest a rather aggressive effort to stem decline. With further hindsight, it is clear that Saudi Aramco was caught a bit off guard by decline in existing production. But over time, they were able to complete several decline mitigation projects as well as many so-called mega-projects with many million barrels per day of new production. With each project, the technological sophistication has grown - along with the expense. The Khurais redevelopment, which is reportedly producing as expected, features centralized facilities for oil, gas, and injection water processing. Water goes out, and oil comes back.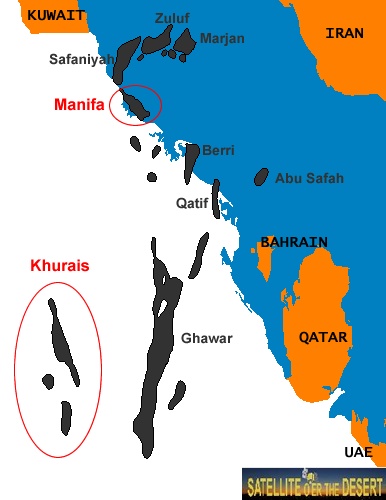 |
 | |
| Figure 4. Left: map showing Saudi oil fields, Right: Khurais Project pipeline network (source: Snowden's laptop) | ||
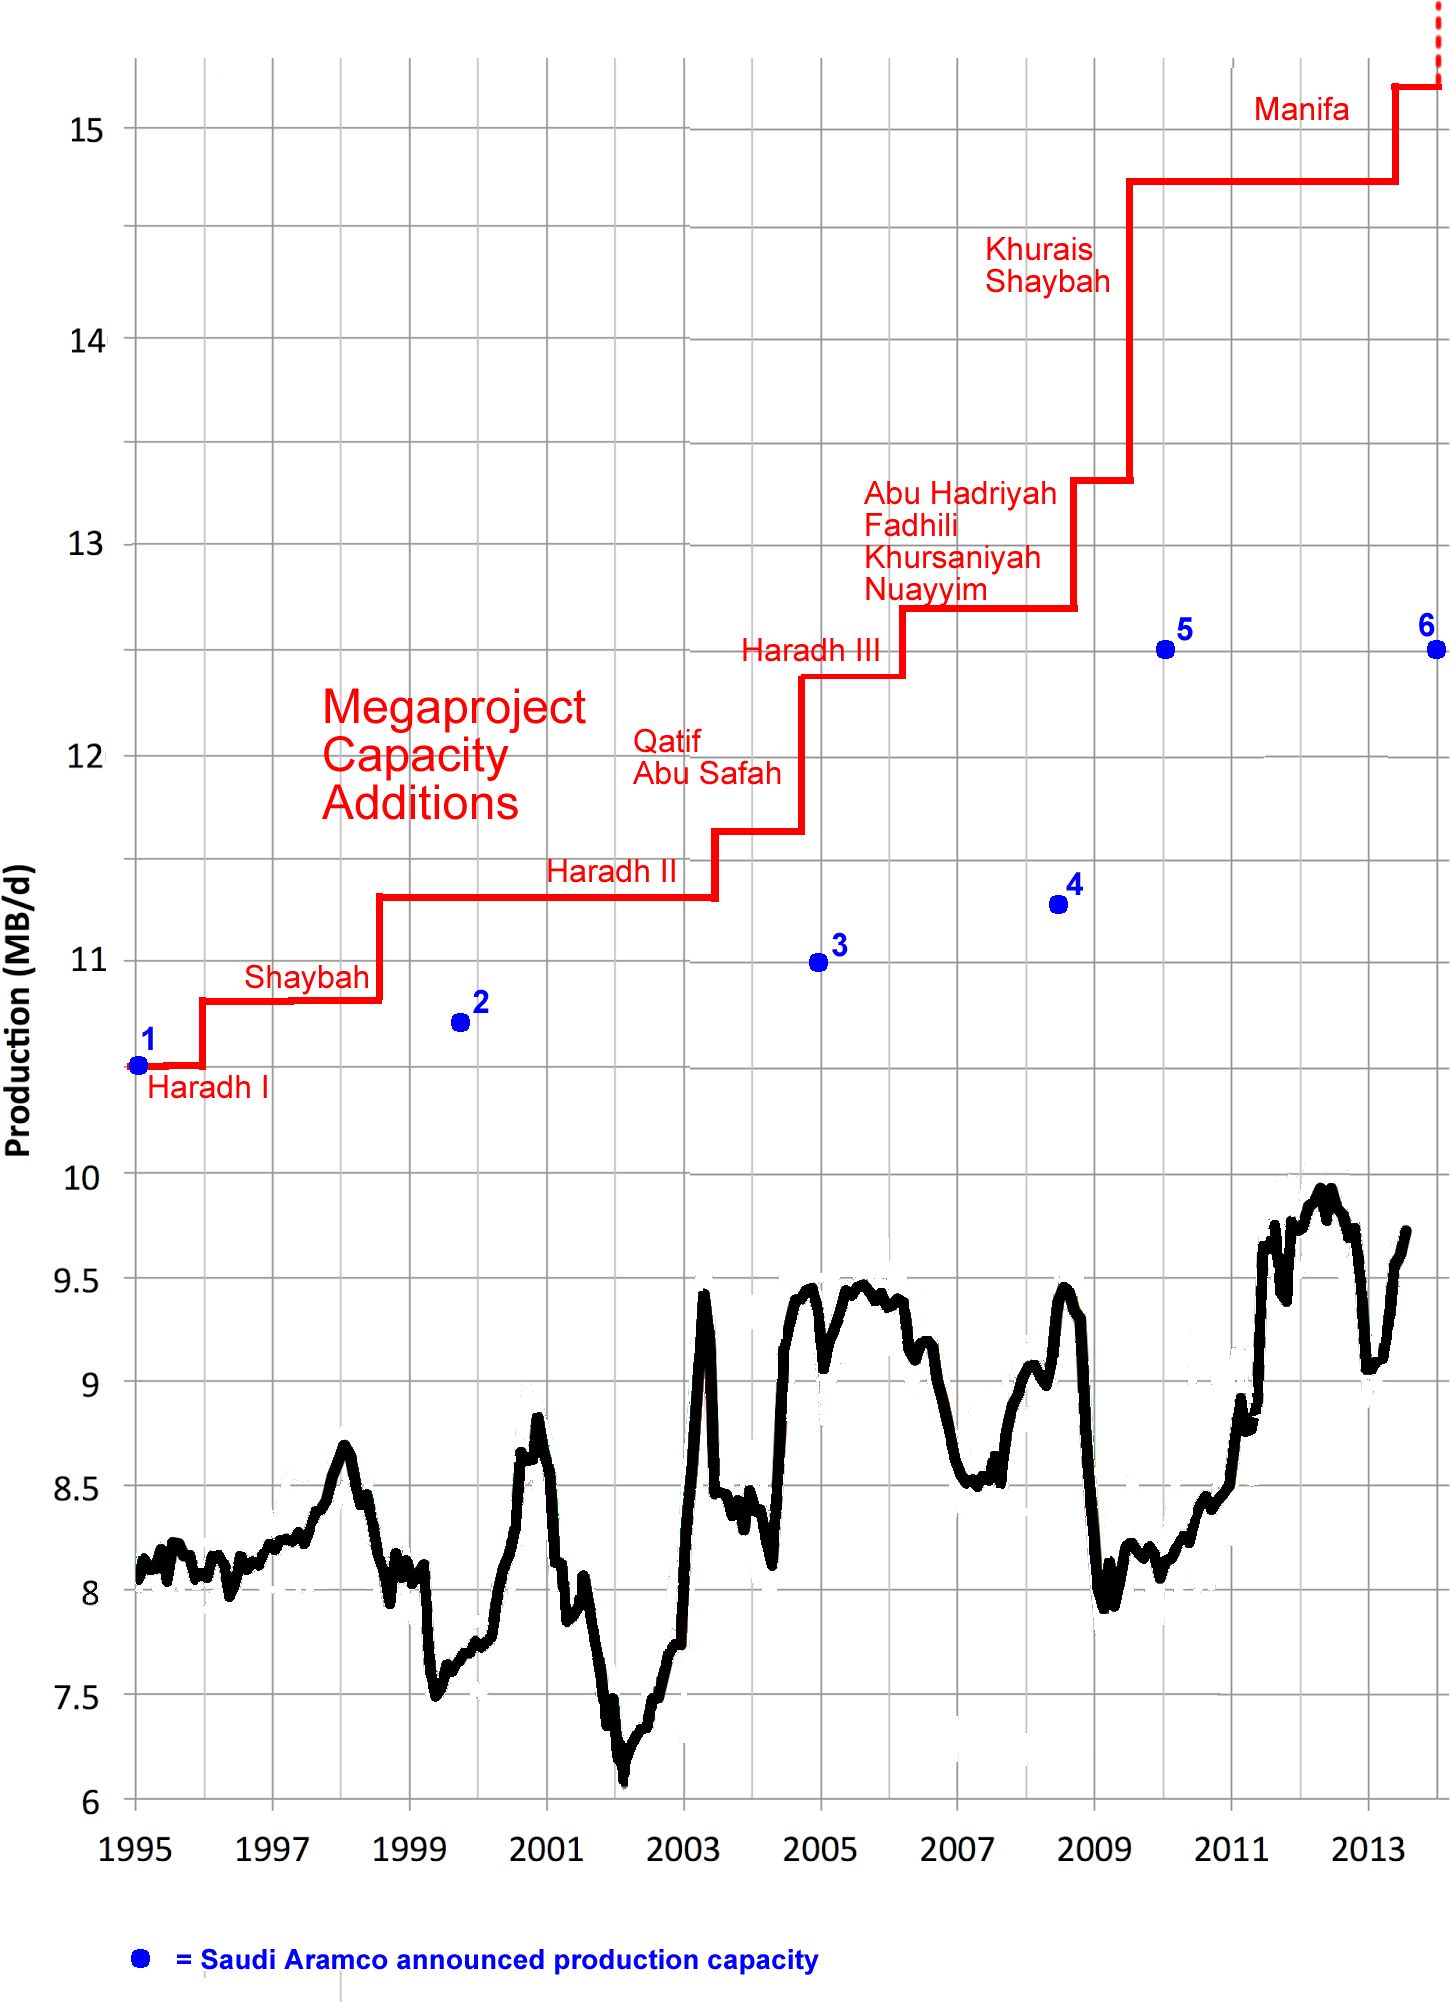 |
| Figure 5. Saudi Arabian crude oil production increases from megaprojects since 1996, compared with actual crude production (source: Stuart Staniford). Cumulative increases are superimposed on the Saudi Aramco reported baseline value of 10.5 mbpd capacity in 1995. Blue dots denote values obtained from references 1, 2, 3, 4, 5, 6 |
- Saudi Aramco has generally been self-consistent when reporting spare capacity and total capacity in light of actual production
- Production capacity increased subsequent to startup of megaprojects. However, the net production capacity increases were uniformly and substantially less than the planned increments. In total, 5 million barrels per day of production was added, but capacity increased by only 2 mbpd.
- It is most unlikely that reported production capacities accurately reflected what was producible at any point in time, given the reported values as correlated with the timing of the increases from the megaprojects.
- However, actual production did not generally increase immediately after projects were completed, indicating that production capacity was not completely exhausted beforehand. But there was certainly an impetus to add a lot of production quickly.
Addendum: According to this news report, oil has not actually flowed yet from Manifa. The new Jubail refinery has reportedly no received any Manifa oil as of yet:
The refinery is configured to run on heavy crude oil. But two industry sources said the refinery had not received any of the heavy crude expected from Aramco's new Manifa field and that it was running instead on light crude. Aramco said in April that it had started production at Manifa.-Reuters
Still the One?
Despite all of the negativity emitted above, it is also evident that Saudi Arabia has had and will continue to have a role as the primary provider of spare capacity which can be deployed to buffer variability in world demand. It can do this because Saudi Aramco, the largest oil company in the world, can effect oil prices by virtue of what it can put on or take off the world market. Contrast the Saudi production profile with that of the United States, shown below.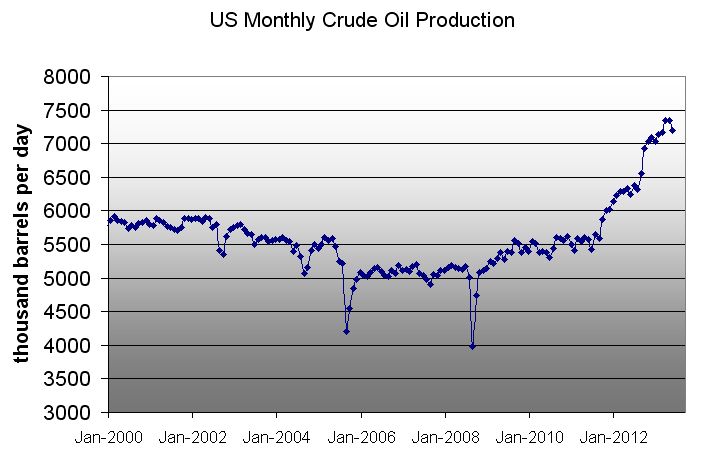 |
| Figure 6. United States monthly crude oil production (source: EIA) |
The Hungry Cow
The other new "above ground factor" is the problem of growing internal consumption in Saudi Arabia, of just about everyting including oil. To air condition all of those cows, it takes a lot of electricity (and currently oil). And all of that milk feeds a growing, young population. But that milk is bound to get more expensive, since the aquifers from which those massive dairy operations get their water are being rapidly depleted.Milk consumption in Saudi Arabia reached 729.4 million litres in 2012It seems Saudi Arabia has cash flow problems, although it is hard to imagine why, given that they are currently producing as much oil as ever at $100/barrel. For one thing, their population keeps growing:
...
The Kingdom has already depleted 70% of these sources of water and must now turn increasingly to desalinisation which when factored into the cost of producing fresh milk is very expensive. Experts have estimated that it takes between 500- 1000 litres of fresh water to produce 1 litre of fresh milk if one takes into around the irrigation required to grow the Rhodes grass or Alfalfa required to feed the cows.
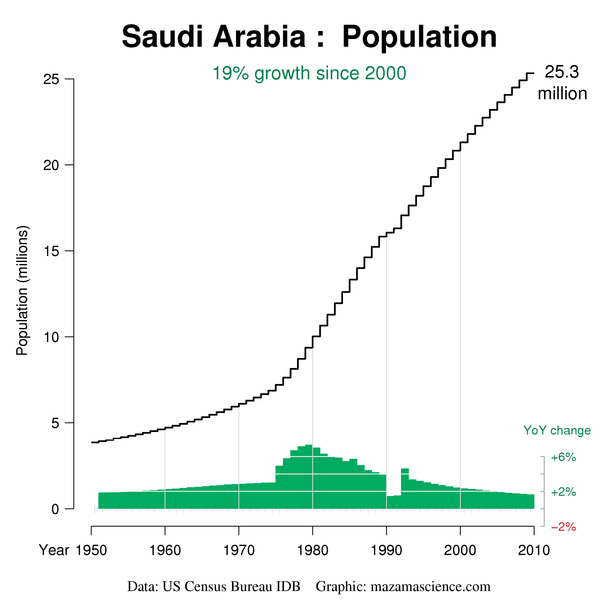
|
| Figure 7. Saudi Arabia population growth (source: Thanks, Jonathan!) |
Saudi Aramco is overseen by the Petroleum and Mineral Resources Ministry and, to a lesser extent, the Supreme Petroleum Council, an executive body. The company pays royalties and dividends to the state and supplies domestic refineries. Revenues go to the Finance Ministry, but the amounts are not published. There is no transparency in the national budgeting process, and it is unclear how oil revenues are used. Environmental impact assessments are required, but the results are not made public. Laws and decrees concerning the extractive industries are published and include guidelines for the licensing process in sectors other than upstream oil, but do not contain details on fiscal arrangements. Saudi Arabia has no freedom of information law.
Some ends up in London, where some Saudi tourists spend the entire summer. Of course, this was true in 2002 (and oil was $26/barrel then).
But they do seem to have money to throw around to garner political influence (note that the US does the same with money that it doesn't have). And they have grand plans for looking beyond their petro-heritage:


