
Since wells can be seen on high-resolution satellite images, something can definitely be learned by taking a complete inventory of current wells and comparing with a similar set from several years ago. Since a single satellite view does not have any implicit time information, ideally we would like to have several high-resolution image sets to fully characterize development over a period of time. Some information of this sort is out there -- for a price. However, much can be learned by supplementing a single satellite view with additional information, such as:
- comparisons with georeferenced published well layouts
- well appearance (weathering relative to surroundings)
- well status (in development, drilling, abandoned)
- is there evidence for the well in earlier (or later) low resolution images
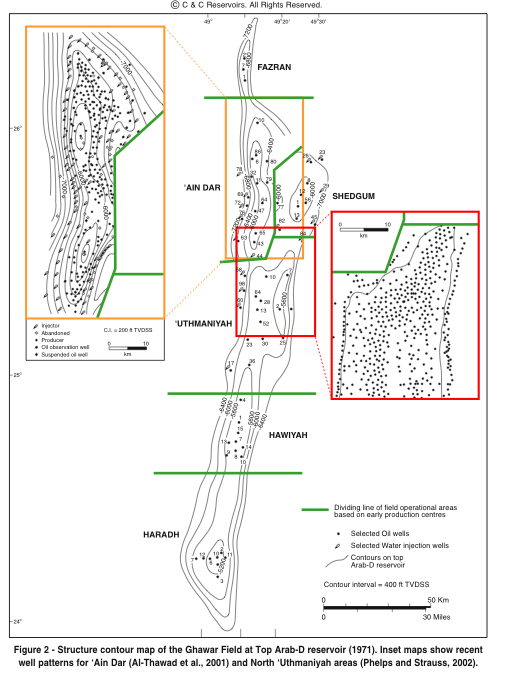
For the 'Ain Dar and Uthmaniyah areas of Ghawar, there are a couple of external sources of well layouts available: an "industry map" discussed by Stuart Staniford in this post at theoildrum.com, and second, several figures in Joe Voelker's Thesis (see Figure 5.6) from Stanford University reprinted from other publications. The precise dates for the well inventories from these figures is not known, although the source publications date from 2000-2002. Also unknown is whether or not they indeed represent complete inventories. For part of the Uthmaniya area, the datasets can be cross checked as there is some overlap between maps. The number of wells present on one map and not the other is relatively small.
For Hawiyah, there is much less available. There is a full Ghawar graphic from a promotional publication by Austin GeoModeling/Recon dating to 2004 (see page 20 in the document) which has well placements. This well inventory likely also dates from around the years 2000-2002, as none of the Haradh II increment wells are shown.
Methodology
The strategy is then to import the map of interest into Google Earth as a raster graphic overlay (ideally with a transparent background) and then align it precisely (georeference) with the visible well locations indicated by placemarks. Wells which have corresponding locations on the map are presumed to have been in place on the date of the map set, and the remaining visible wells are candidates for having been developed more recently. This can often be confirmed by visual inspection as discussed below.
When a well site is prepared for drilling in the Saudi Arabian desert, there is a marked visual change in the color around the wellhead due to less weathering of the newly exposed sand. This difference fades over a number of years. This can be combined with other visual clues, such as the size and shape of the site area. Freshly prepared sites are assumed candidates for drilling within a short time from when the image was taken.
Results for 'Ain Dar and Uthmaniyah
Wells in 'Ain Dar and Uthmaniyah were geotagged and assigned the following classifications:
- "Old" wells present in 2000. Some might have been subsequently reworked.
- "Recent" wells developed between 2000 and 2003
- "New" wells being developed, ready for drilling, or with active rigs.
The results, shown below, indicate a marked concentration of development toward the middle of the field. Although this is to be expected, the amount of drilling that has occured since 2000 is remarkable.
 |
| Oil Wells in North Ghawar: a) before ca. 2000, b) between 2000 and 2003, and c) developed after 2003 including sites prepared for drilling and those undergoing active drilling in summer 2006. Water injectors are not shown. |
The results shown in panel c show considerable clustering of development in certain areas, particularly in Uthmaniyah. A closer look at these regions for the motivation behind this trend will be forthcoming.
Results for Hawiyah
Wells in Hawiyah were similarly divided into 3 groups:
- Wells present in 2000
- Wells added since 2000 but weathered
- Fresh (unweathered) wells, prepared sites, and those being drilled
 |  | |
Wells before 2000 (red) | New wells and sites |
Analysis of well development in Hawiyah is more problematic because only the eastern half is covered in 2006-vintage high resolution. However, similar a similar development pattern is observed on both flanks. New wells in the northeast corner are most probably injectors. Analysis of a 2006 DigitalGlobe preview for the northwest corner suggests about a dozen more wells present by that date, with half of those being new water injectors, although some of the total might be gas wells.
Overall Scope of Ghawar Well Development 2000-2006
In addition to the geographic progression of the drilling in recent years, also notable is the overall quantity of development, as shown in the table below. For example, total of 21 rigs were drilling for oil in May 2006 in these regions. Adding in possible rigs operating in the Shedgum area, this accounts for over a third of the total land rigs drilling for oil in 2006. Moreover, new drilling added 50% more wells in each of the studied in only about 6 years time. Given the high production rate of Saudi wells, with the additional factor that most newer wells are horizontal or MRC wells, a lot of production capacity has been replaced.
| Summary of Well Development 2000-2006 | ||||||
|---|---|---|---|---|---|---|
| Pre-Drill1 | Drilling | Fresh | > 2003 | > 2000 | Older | |
| ANDR | 22(10) | 6 | 12 | 14 | 95 | 272 |
| UTMH | 44(40) | 11 | 33 | 29 | 195 | 539 |
| HWYH | 10(9) | 3 | 25 | ? | 79 | 159 |
| 1Number in parenthesis identified with high probability | ||||||
[Above table edited 2/20/08. One rig classified as oil was determined to be re-drilling an existing gas well]
One other way to ascertain the extent of drilling over a period of time is to make use of the Saudi Aramco numbering scheme for oil wells. In the Ghawar area, for example, wells are labeled with the subfield prefix (e.g. ANDR for 'Ain Dar) and a sequential number. In 2006, Saudi Aramco engineers contributed the following SPE paper:
IPTC 10395 Optimizing Maximum Reservoir Contact Wells: Application to Saudi Arabian Reservoirs (link)
This paper provides information on 3 MRC wells in north Ghawar, two of them in 'Ain Dar, The first of these, ANDR 524, was drilled sometime in 2004. The other, ANDR 550, was drilled before May 2006. This implies that 27 wells were drilled in 'Ain Dar in two years or less, at rate reasonably consistent with the tabular data above. Note that these are total wells, including gas. As of 2006, there were 5 gas wells in 'Ain Dar, and it is possible that two of these were added during the 2004-2006 time frame.

Two MRC wells in 'Ain Dar. The orange trace
indicates Arab D -6000 ft. contour.
In conclusion, the re-drilling of Ghawar - even excluding the much lauded Haradh III increment -- can justifiably be classified as the largest Saudi Megaproject, at least in terms of wells drilled. And given the observed fact that virtually all of Uthmaniyah and 'Ain Dar have been filled in, there is considerably less room for further development to maintain current production rates.


5 comments:
That is a great piece of analysis! More than one way to skin a cat.
I agree that this is a great piece of analysis. The one question I have is that in the first photo, there is no definion for the red dots.
Also, how many of the early wells are still in production - is the third section of the first photo showing only active wells?
Thanks dave and bryant
dave,
The dots in each of the three frames in the first graphic represent oil wells. The red in the first frame are oil wells present in (about) 2000.
There is no easy way to determine whether or not a well is still producing. Most of them probably are, but the older ones on the field periphery are producing as much (or more) water as oil. If there is no longer a pipeline connected, then it has been abandoned. But it might just be shut in with no other visible sign.
This is good news, since it means less global warming and an earlier switch to alternatives. Prescription for the planet, by Tom Blees, has the answer.
Hi greaat reading your blog
Post a Comment