
 Now showing: a movie on the drilling of Uthmaniyah. Using a set of wells in a productive (but now rather depleted) slice of this part of the Saudi oil field of Ghawar, it is possible to deduce to drilling sequence of these wells using the identifiers assigned to the wells as they are drilled. Given a few known dates for well placement, a timeline for overall development can be constructed and displayed as an animation. Enjoy the movie.
Uthmaniyah is both by area and by production the largest operational segment of Ghawar. The more productive northern part of Uthmaniyah was also the first part developed, is the most depleted, and has also been extensively studied. In fact, this analysis is only made possible by selected publications of Dr. Shiv Dasgupta, Microseismic Project Manager for Saudi Aramco, covering one small section of Ghawar. But rather than bore you up front with further details of how this short clip was put together, I'll first just present the video. Green dots mark the individual wells as they are drilled. (Click the play button on the player below)
For information on the music for the above video, go here.
The Making of the Movie
Until the early 1990s, all wells (oil, water injectors, gas, etc.) in Saudi Arabia were assigned a numerical ID with the same sequence of numbers for a given field or area. The Ghawar areas are all numbered independently, such that the discovery well in Uthmaniyah is UTMN-1 and the tenth well in 'Ain Dar is ANDR-10, etc. Under this assumption, a map showing both the locations and IDs of the various wells also gives the drilling sequence. Furthermore, if the drilling of a given well (by ID) can be independently attributed to a specific date, the drilling sequence can be anchored at that date. For example, the first well was placed in Uthmaniyah in around 1951 -- thus providing the lower anchor for the sequence. Of course, this depends on the wells used being representative of the entire Uthmaniyah area. Fortunately, this appears to be true in this case. I will discuss below the sources of information and the assumptions made when assigning dates for the various wells.
The sequencing of wells to create the animation was done using Google Earth. First, the well layout map was added as an image overlay and adjusted to match the actual well locations. Second, placemarks with corresponding well IDs were labeled as such, and these were ordered numerically. Time information is added for each well by editing an exported KML file and adding TIMESPAN tags. Wells with IDs between those of anchor dates were spread out uniformly in time. After reloading the modified KML file, animation controls appear in Google Earth. A screen grabber program was used to record the animation.
The wells used in this analysis come from Figure 4 in the Dasgupta paper "When 4-D seismic is not applicable: Alternative monitoring scenarios for the Arab-D reservoir in the Ghawar Field" (link: Geophysical Prospecting, 2005,53,215-227). This slice contains the first few oil wells drilled in Uthmaniyah as well as the first few non-associated gas wells placed in Ghawar beginning in 1983. This same study area is also shown in Figure 3 of another Dasgupta paper, "Reservoir Monitoring with Permanent Borehole Sensors" (link: SEG Technical Program Expanded Abstracts -- 2004). This figure is shown below:

The well IDs on this figure are a bit harder to read, but it also shows oil thickness contours for the area. These will be discussed later in the analysis. The exact date corresponding to the well inventory used for these sources is not known, but it is likely before 2004. Note that the latter figure has a few more recent wells. Wells drilled subsequent to this set are identified for the satellite imagery as presented in Drilling Ghawar in the 21st Century.
Drilling In The Years
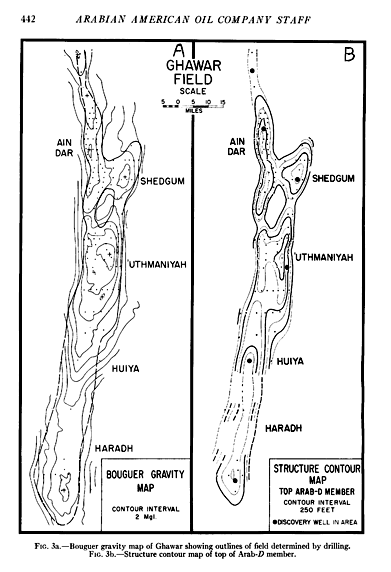
I will cover the various phases of well drilling in Uthmaniyah and discuss the various evidence which relates the well sequence to when the wells were actually put in place. Aside from the date of the discovery well, the first clues are found in a Arabian-American Map dating to 1959. This shows the pattern for the delineation wells covering the field. This set of wells on this map is likely incomplete, but we can use it to identify wells that were present at that time. Shown below are the wells locations identified using Google Earth that are present on the 1959 map and their IDs as determined from the above well maps.
 |  Uthmaniyah wells present in 1959 Arabian-American map (left) and in Dasgupta study area showing Arab-D reservoir contours (above). Note the location of the first well on the far east flank. Wells 10, 21, 26, and 36 were identified from other sources. |
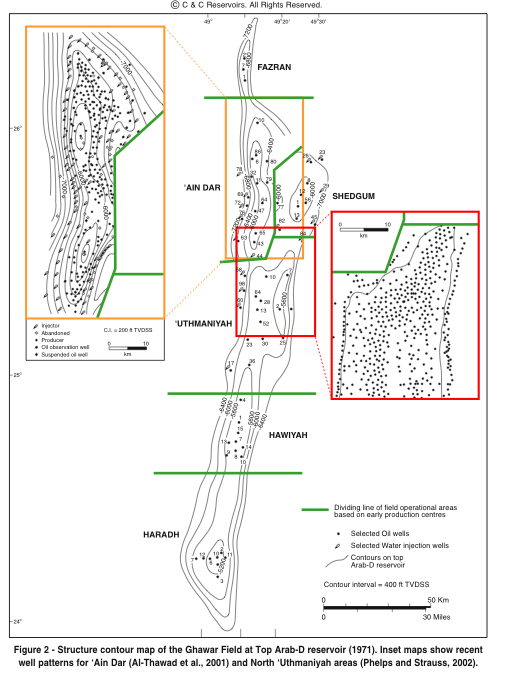
From the above we can conclude that at least 46 wells were drilled by 1959. Next, we have an Industry Map dating to 1971. This map is probably even less conplete, but it does help identify a few more wells from the 1959 set. Furthermore, water injection was initiated in Uthmaniyah in the late 1960s, first with gravity wells and then with pressure injectors in the early 70s. The field pressure profile is shown below.

Arab-D reservoir pressure in Uthmaniyah. Data from Benkendorfer et. al., "Integrated Reservoir Modelling of a Major Arabian Carbonate Reservoir" (SPE 29869)
It is probably sufficient to assume that the peripheral wells shown below were probably put in around 1970 +/- 3 years or so.

Got Gas?
In 1983, deep wells were first drilled into the Khuff-C formation deep beneath the Arab-D. A paper by Shiv Dasgupta (who else?) and friends, Reservoir characterization of Permian Khuff-C carbonate in the supergiant Ghawar Field of Saudi Arabia (link: The Leading Edge, Volume 20, Issue 7, pp. 706-717, July 2001), has a map showing several wells for this early phase of non-associated gas development as well as a more recent phase. The wells are not identified, but all were found to correspond to existing wells as per Google Earth and several corresponded with those assigned IDs as per the other Dasgupta papers. These are shown in the figure below as yellow placemarks.

Three other wells correlated with their IDs have numerical values of 1807-1809, and I believed that this represents a distinct ID grouping (starting at 1800) for these later wells.
From here on, things get much less clear. Oil production and drilling were both curtailed in the mid 1980s due to low prices, but activity started ramping up in the late 1980s and especially in 1991 following the Gulf War. The study area well IDs values seem to extend through the 600s, but then no wells are found with values from 700-999. The evidence, sparce as it is, suggests that these ID values were skipped and numbering was restarted at 1000 for the big ramp up in 1991.
Getting Squeezed
Let's now revisit the second Dasgupta paper from above and the oil column thickness represented in Figure 3 of that work. Shown below are all of the identified wells superimposed on a recreation of this data as a Google Earth vector overlay. The green area represents the thickest remaining oil layer (over 120 feet), but note that this does not represent a complete oil layer either. The concentration of wells therein is clear.

Using the well IDs and rough time frames for even more recent wells, we can step through the next few development stages. Shown below are wells with IDs in the 1000-1199 range.

These wells are seemingly placed in front of the advancing water flood at an earlier date. As we move into the 1400 series, the wells are placed increasingly to the east.

In the final phase (1500+), wells are almost exclusively located in the thicker oil region but are rather uniformly distributed therein:

Eleven of these wells (with IDs in the range 1500-1539) are part of this latter set, with the remaining having been put in since 2004. This delineation marks the final anchor point for the video.
One remaining question is, what of the other wells? As of yet, I haven't found any mention of wells in the 1300 series, although a large number of wells in the 1200 series, feeding in to the bottom two Gas Oil Separation Plants (GOSPs) for Uthmaniyah, apparently exist. And although a number of wells in the 1400 series are in the Dasgupta study area, some wells in this same series also reportedly feed into the bottom GOSPs as well. Thus, well classification is seemingly not location-specific. Any additional information which would help clarify the ID classifications for these later wells would be welcomed.
A Visual Connection: UTMN-1093
One of the wells identified in the study area, UTMN-1093, shows up online in a photograph taken by either a Saudi Aramco employee of one of its contractors. The location in the study area is shown below:

Shown below is a crop from this photo (unknown date, but likely after the digital camera age) and a picture from above using Google Earth. Besides the color difference, one thing of note is that the boundary around the site prepared for the well consists of a large berm of sand. This probably represents a re-entry of this well sometime recently.
 |  |
Conclusion
Using well IDs to trace the development history of Uthmaniyah in the Ghawar oil field clearly shows the concentration of drilling as depletion sets in, although a precise time correlation in the 1990s is somewhat elusive. In any event, since your computer has already downloaded it once, you might as well watch it again.


1 comment:
Awesome work, The Saudis must hate you.
Imagine the information that the US and other governments with spy satellites and teams of analysts must posses (though I doubt they have it set to music), hard to believe they don't know peak oil is coming, hard to believe Iraq is about anything other than oil.
5Y
Post a Comment