Analysts Neil McMahon and Ben Dell from Bernstein Research are
back with more analysis. When we last
heard from them, they were looking for Haradh in all the wrong places and reporting on the widespread dismantling and bulldozing of oil wells in Ghawar, the super giant oil field in Saudi Arabia. As promised, they have returned with a study purporting to show that Ghawar is not rapidly depleting because it is not sinking. Using the the technique of Synthetic Aperature Radar (SAR) Interferometry, which is capable of measuring millimeter vertical movements via satellite, they found not subsidence but actually a slight rise. Despite the rather dubious premise behind this, given that Ghawar is being pressurized by injecting water, it warranted another look. However, before getting to that question, my analysis of their analysis rapidly became one of forensic pathology. Alas, they have misplaced Ghawar by a few miles, rendering their interpretations misplaced as well. Also, their technique for quantifying changes in oil field infrastructure was found to be rather inaccurate. This can't end well.
Not Sinking, But Moving To The Northeast
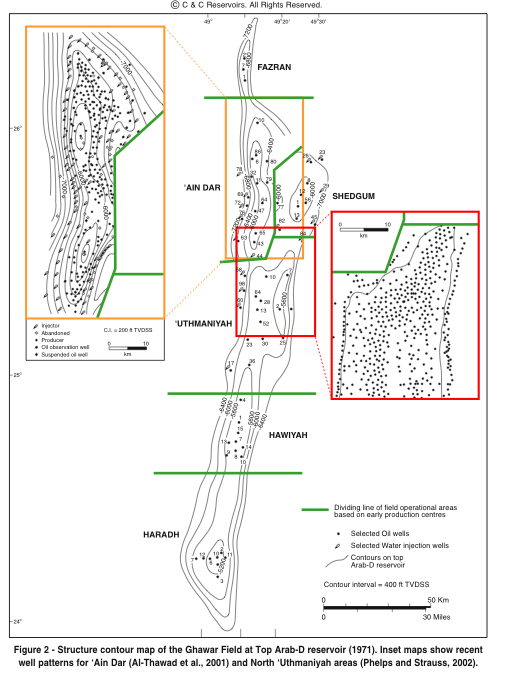
Ghawar is the largest oil field in the world. It is divided into six operational areas, as shown in the figure at right. The most productive yet most depleted areas of the field are 'Ain Dar, Shedgum, and the northern two thirds of Uthmaniyah. Haradh has undergone three drilling increments beginning in the mid 1990s and culminating with the Haradh III project in 2006. In my
critique of their previous report, I noted that they claimed to have determined the extent of drilling for Haradh III -- despite the fact that their data did not cover the area in which Haradh III is located. They have responded with new data but with the same interpretation as before.
However, something else was amiss with a figure they provided showing the area around Haradh III along with identified well locations. The underlying satellite image has numerous surface features which can be used to align an overlay of their data on Google Earth. Most prominent in the Haradh area is a
line of irrigated crop circles along a river bed. This line cuts across the "toe" of Ghawar, the location of the Haradh III increment. Upon using this feature to align the Bernstein data, it was apparent that they have Haradh located 10 miles to the northeast of where it actually is. This is shown in the figure below.

The black trace indicates the Original Oil-Water Contact for Haradh as determined
previously. This location is consistent with several maps with well locations for georeferencing, most notably this paper from Saudi Aramco:
Assessing the Oil Water Contact in Haradh Arab-DThe green, blue, and yellow circles correspond to Haradh III well locations
determined using 2004 high resolution and 2006 low resolution DigitalGlobe (Quickbird) satellite imagery. The red trace indicated the field boundary as suggested by the Bernstein authors, and the red triangles indicate the positions of "objects" found using their automated feature identification method (see the
previous critique for a discussion).
On the plus side, it is refreshing to see that their computer algorithm for feature identification (CAFE, perhaps) did find numerous Haradh III wells. Of course, more than half of the wells were certainly neglected because the authors weren't looking for them. There is also a curious grouping of found wells to the north. The authors likely presumed that these were also Haradh III wells, but their correct location places them in the upper half of the Haradh II increment. Also, the close spacing of these wells is rather unusual. Given that most of these wells are in an area not yet covered by high-resolution imagery in Google Earth, a more detailed appraisal of their algorithm's proficiency at counting wells in Haradh must wait.

This displacement error exists in all of the data presented in this and the previous Bernstein report as well, as shown at right. Their drilling activity data (see the figure from the recent Wall Street Journal
story) has been recreated. The black traces indicate the correct Ghawar boundaries, whereas the red trace denotes that assumed by the Bernstein authors. The alignment of their data is facilitated by date palm groves located east of the field, some prominant (white) features west of the field, and irrigation circles to the south. To play along at home, load this
Google Earth file.
Instead of presenting the identified new (and disappearing) well locations individually, the authors calculated a "activity density" and layered that over the satellite data. The contour colors indicate increasing (yellow to red) and decreasing (blue to purple) activity. One result of the corrected field geography is that their interpretation that the southern-most region of enhanced drilling activity in 2004-2007 was due to the Hawiyah NGL project (a revised conclusion from their first report) becomes cloudy given that over half of the "hot spot" is now in Uthmaniyah.

There is no visual evidence (using high-resolution 2006 imagery, where one can distinguish between oil and gas wells) that drilling of new gas wells was comparable to the drilling of new oil wells. As discussed in
this post, overall drilling in 2006 was predominantly for oil, particularly in Uthmaniyah. This is shown in the figure at left, with green and yellow placemarks denoting oil and gas wells respectively, and with circle and diamond shapes representing new sites and drilling rigs respectively. Most of the new gas wells nearest to the "hot spot" are drilled into the Jauf sandstone formation on the east side of the field. It appears more likely that the "hot spot", if it does reflects drilling activity, is due to new oil wells (rather than gas) in south Uthmaniyah and north Hawiyah. What is needed is a more complete analysis of what is found using their (computer automated) approach versus that identified manually.
Looks Dark, But Is It A Well?Fortunately, the authors provided data showing the locations of found "objects" in the Shedgum area. This data was (as above) used as an overlay in Google Earth and the well identifications therein were compared with those found by a "hobbyist" (OK, by me identifying the wells manually).

Since much of Shedgum is as yet not covered at high resolution in GE, I restricted the analysis region to include only the hi-res Summer 2006 imagery currently visible as shown in the figure at right by the red rectangle. All Shedgum wells visible in the Google Earth 2006 view are shown, including oil wells (red), water injectors (blue), and gas wells (yellow). The one rig visible, determined to be re-drilling an old gas well, is indicated by the yellow diamond. Note that the presumed field boundary lies along the peripheral injectors.
The overall comparison results are presented in the table below. Note that the fact that the total wells counted is the same for both methods, it is not the same wells. First, 15 of the Bernstein wells are presumed to exist (late 2006-2007) but not visible in the 2006 GE image. Second, 22 Bernstein wells are found to not be distinct wells (or wells at all). Finally, 37 visible wells are missed by the Bernstein approach.

Shown below is the geographical distribution of the discrepancies. Most of the false negatives are water injection wells on the flank. Most are older wells and offer less contrast for the computer algorithm. In addition, a number of these have been deactiviate (but not "bulldozed!").


The false positives are interesting. Three of the objects identified are actually towers for high voltage electricity transmission, as seen at right. Other mistakes include structures associated with the gas-oil separation plant (
image), pipeline infrastructure, and rock outcroppings.
Gas wells present a more complex problem. They have rather distinctive structures associated with them, and the sizes are such that they are usually identified as separate wells using the automated method. See
this article for information on identifying wells in satellite imagery. The wellhead is located in the center of the larger feature, but it is often not identified (as was the case of the example below right). So a single gas well could be counted as 0-4 objects depending on the prominance of the various features. What is needed is a count of the wellheads instead of "objects", but their approach does not lend itself to that possibility.

With regards to gas wells, one false negative was rather curious. An old gas well being reworked this in summer 2006 (
image), but this was missed completely by their algorithm. Perhaps Saudi Aramco should they set it on fire next time to make it more prominant. In a similar way, oil wells identifications are rarely centered on the wellhead but rather on remnants of the mud pit left over from drilling. Deciding whether or not a well exists (or has been "bulldozed") based on the visibility of this feature is probably not a good idea.

One final comparison regarding Shedgum. Shown below are the "objects" identified across Shedgum since 2004, according to data from their report. This is superimposed on their density contours data (corresponding to the 2004-2007 timeframe) as described earlier. It is not clear how one arrives at the density representation from the object geographical distribution. An eventual update of the Google Earth imagery will help confirm whether or not all these wells are indeed where the algorithm says they are.
The Rise and Fall of GhawarFinally, we arrive at the debateable premise of the second report. Will Ghawar sink as it is rapidly emptied of oil, and will it rise if water is injected too fast? Can such a change be measured? And if so, does the failure to measure sinking constitute evidence that Ghawar is "not in significant trouble" (to quote the authors), and that "Peak Oil" warnings are unfounded? Or, in to quote Donald Rumsfeld, is absence of evidence evidence of absence? The resounding answer to at least one of these questions is...well, not really.
If subsidence (or alternately, bloating) occurs, can it be measured via satellite? The answer to that is
yes, although the circumstances for Ghawar are quite different from those cases. It is well know that Ghawar has been subjected to pressurized water injection from the periphery of the field since about 1970. The goal is to keep the bottomhole pressure at the producers well above the bubble point. Before that time, pressures dropped significantly from the initial pressure due to the aquifer (from over 3000 psi to about 2000 psi in Uthmaniyah). However, they have been maintained at about 2800 psi up to the present.
I could speculate on this further, but it would be just that given my lack of expertise in deep reservoir rock physics. Given the many flaws related to the counting of wells in the two Bernstein reports, I suggest they do a test run on something simpler.
Apparently, Saudi Aramco is going to do some injecting and draining of the small field of Harmaliyah. Perhaps they should look at that first. Or maybe the authors should explain first why (as their data seems to suggest) the land to the east of Shedgum, where aquifers are being drained to water the date palm orchards, seems to be rising more than Shedgum.
ConclusionI (hesitantly) suggest that the Bernstein authors revise their conclusions based on (at least) a correct placement of the Ghawar field. Consider counting wells instead of "objects". Ghawar may be crashing, or it might be doing just fine, but their current interpretation and data set don't really push the needle one way or the other. It is likely true that Shedgum is being drilled for the remaining oil, and visual evidence suggests that Uthmaniyah and Hawiyah are attracting serious attention as well. The question is not really how well Saudi Aramco is managing their fields -- they are probably doing a fine job. The question, at least for the near term, is how they are managing their existing production rates.