
 Getting Wet
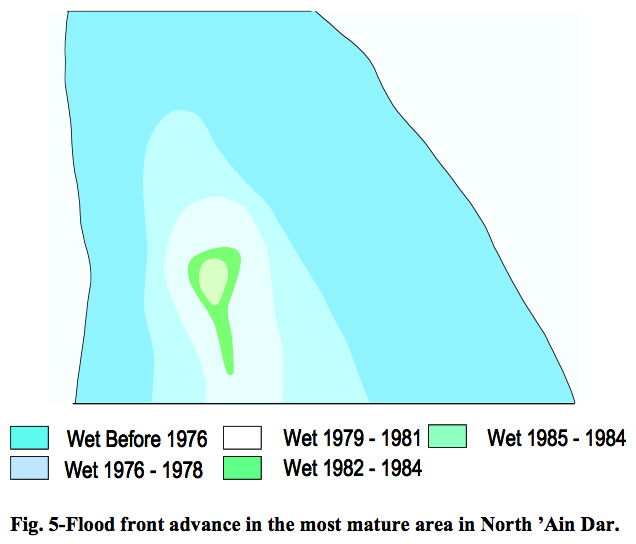
The northern part of the 'Ain Dar area is the most mature part of the Ghawar oil field, and the water flood used to maintain production levels has been monitored for many years. A paper published in 2005, SPE 93439: Water Management in North 'Ain Dar, Saudi Arabia , discusses several strategies for reducing water production from the field. Figure 5 from this paper shows the flood front advance through the mid 1980s. As shown in the image below right, there has been quite a number of wells drilled to the south of the study area in the past few years, including some wells being drilled in May 2006. Given that 20 years have passed, how much oil is left to be had there?
 Stuart Staniford of The Oil Drum has used this information along with data from other publications in an investigation of how much oil is left. One resource he used was a paper by Hussain et al Optimizing Maximum-Reservoir-Contact wells: Application to Saudi Arabian Reservoirs presented to the 2005 International Petroleum Technology Conference (IPTC 10395). This work focused on the optimization of two MRC (maximum reservoir contact) wells in south 'Ain Dar (identified as ANDR-"XYZ") and one in Shedgum (SDGM-"PQR"), but it also briefly described another MRC well in 'Ain Dar (ANDR-"ABC"). Diagrams of these wells showed their locations relative to nearby wells along with oil column thickness in the vicinity. Staniford ascertained the location of ANDR-"XYZ" as being in south 'Ain Dar.
Using the well placements determined using Google Earth, I have identifed the precise locations of the other two wells, with ANDR-"ABC" being located in north 'Ain Dar midway between GOSP-2 (Gas-Oil Separation Plant #1) and GOSP-1. This was the first MRC well placed in north Ghawar as also described in the Water Management paper cited above. According to Saudi Aramco, the motivation for placing this well was to "provide an additional oil producer tied into GOSP-2 to maintain plateau, to reduce the average water cut of the field, and to increase oil recovery".
Despite the obligatory alphabetical coding for secrecy, the real identities of the two 'Ain Dar wells are revealed as ANDR-524 (north) and ANDR-550 (south). As noted previously, this gives a number for the wells developed in the time span between them as approximately 26. This simple correlation is rather useful, but even more useful is my chance recognition of the profile of northern 'Ain Dar in a paper presented at the 25th Annual ESRI International User Conference (2005) entitled "Well Placement Optimization Using GIS", hereafter referred to as the "ESRI" paper.
 The paper discusses a customization of the ArcGIS software package which facilitates oil well placements utilizing a local GIS database of existing well data, reservoir properties, etc. A window from the graphical user interface is shown at right. (Note to authors of this paper: please send me the software and data for usability testing). It so happens that the computer screen shots used for supporting figures also show maps with well layouts for ANDR-524 and vicinity similar to IPTC 10395. Note that the images presented here don't do justice to their obscurity in the context of the paper. There is no discussion regarding them, but rather they appear just as an unfocused part of a screenshot.
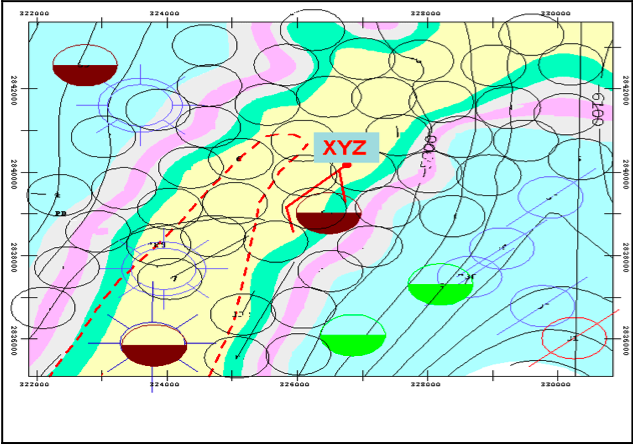
Shown below is a piece of one of the figures showing well spacings around the prospective site for ANDR-524 (not identified) which has been overlayed on northern 'Ain Dar imagery and resized to align wells with those visible. The left pane shows the location of the IPTC 10395 well map in 'Ain Dar., and the right pane shows a close up of the well map from the ESRI paper at the same location.
 |  |
| Geo-referenced ANDR-524 well maps from ITPC (left) and from ESRI (right) | |

Well map with actual well locations indicated by red (before 2000 wells) or green (after 2000 wells) placemarks. A drilling rig (green diamond) is located near the top. Click for larger image.
The grey contours on the overlay are for the top of the Arab-D reservoir. The colored contours represent the thickness of the oil layer, with yellow representing a nearly complete oil layer and blue being more or less watered out The IPTC 10395 figure appears to indicate that the boundary between light and medium blue is a thickness of 30 feet.

Also of interest is that the waterflood has proceeded unevenly from the northeast, leaving a finger of oil below the crest to the northeast. Pockets of stranded oil are observed at the top and right in the overlay area of the figure.
Other screenshot fragments provide information on the geometry of well 524 and labels for the identities of a number of surrounding wells. One such overlay has been added in the figure at right, and I have added labels for the identified wells. Well 95 appears to be inactive. The revealed identity of ANDR-235 is most fortuitous, as it helps to locate another feature in the north 'Ain Dar field: a gas cap near the top of the Arab-D structure.
Gas Caps
Both the IPTC 10395 maps for ANDR-524 (above) and the map for ANDR-550 (well "XYZ", shown below) have have unidentified dashed red outlines. It was suggested that this represents the waterflood front in the case of the map below. However, it is determined here that these traces delineate gas caps.
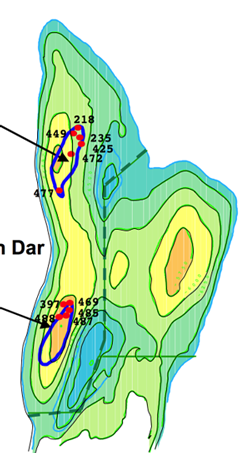 Although the oil in Ghawar is undersaturated with respect to gas, injection of gas for pressure maintenance earlier in the field's history has left gas caps in the north and south crestal areas of 'Ain Dar. The presence of the caps can cause problems for wells producing the oil beneath, as described by Kokal et. al. in Asphaltene Precipitation in High Gas-Oil Ratio Wells (SPE 81567). Shown at right is a fragment from one of the figures showing the gas cap locations and the locations of problem wells (including ANDR-235 identified earlier). An attempt to align this figure in its entirety with actual well spacings was not successful, but it was possible to align the wells in the northern group (red dots in the figure at right) with the actual well locations (especially ANDR-235). This resulted in the gas cap trace from the figure at right (blue) lining up nicely with the position of the IPTC 10395 trace (dashed red line). The resulting composite map is shown below left, with the gas cap outline indicated in red. Wells put in after 2003 are shown with green placemarks. The lower two drilling rigs (diamonds) are on new sites, whereas the top rig is possibly sidetracking an existing well to tap the stranded oil pocket.
 |  |
| Composit map showing oil layer thickness, identified wells, and gas cap in north 'Ain Dar. | Expanded area showing wells put in after 2003 including two drilling rigs (2006). |
These images suggest that the remaining dry reservoir volume in the northern 'Ain Dar area (yellow area) is mostly filled with gas (red outline). However, much depends to what extent the gas/oil and oil/water interfaces are horizontal and whether the gas cap trace denotes the gas oil contact at the top or the bottom of the reservoir. It is predicted that wells drilled through the gas cap are targeting oil in a "halo" surrounding it. There are several apparent clusters of new wells in the gas cap area, such as the group of several wells being drilled above the southern end of the gas cap shown below in closeup.

Cluster of new wells near the south end of the gas cap
A Sideways Glance
With the near exclusive use of horizontal drilling, it is not possible from an overhead perspective to determine where the target oil is from where the well is. Increasingly, the well head locations are determined by other factors. For example, wells might be located close together to minimize road building expenses. Moreover, even for vertical wells, the vertical layer of the reservoir being tapped is also unknown. However, the ESRI paper yields one more interesting tidbit: a cross section for the ANDR-524 well.
 |  |
Cross section trajectory showing ANDR-524 and nearby wells (left), and resulting cross section (right). Click for readable versions. | |
The figure above right shows the cross section obtained as the thick black line. The vertical trajectories for the labeled wells (on the left) are shown above right. The y-axis is elevation below sea level in feet, and the x-axis is horizontal distance (ft.). The axes and legend labels have been redrawn for clarity. The green line is the top of the ArabD 2A structure, and this is consistent with ANDR-524 being located at -6000ft. below sea level based on the Arab D contours from above. Wells 356 and 95 appear to penetrate 400ft. below the Arab-D top, whereas well 427 seems to be penetrating only the very top of the ArabD -- possibly the 2A. In contrast, at least one lateral of ANDR-524 seems to be accessing very deep rock, assuming that this diagram reflects the actual trajectory for this well.
Summary
At the time reflected by these graphics, there was probably remaining oil to be had in a thin layer at the top and in isolated pockets of stranded oil, but it can't last long at historical production rates for this part of Ghawar.


2 comments:
Amazing detective work, Joules! Thank you.
The hour is certainly later than many people think, isn't it?
Thanks Joules. I love the analysis.
Post a Comment