
 Given the central role Saudi Arabia will play in the world's energy future, the continued fuzziness regarding its oil prospects is cause for concern. According to the IEA 2008 World Energy Outlook, Saudi Arabia will remain the world’s largest producer through at least 2030 as its output climbs from 10.2 mb/d (million barrels per day) in 2007 to 14.4 mb/d in 2015 and 15.6 mb/d in 2030. The future totals include Natural Gas Liquids (NGL) production as well as additions from enhanced oil recovery efforts (EOR).
 The 2008 WEO represents a step forward in that projections are purportedly based on a bottoms-up querying of a database containing reserves and past-production information for 800 of the world's largest oilfields, rather than just being extrapolated to what future demand will require. However, the results obtained from such a data mining effort are limited not only by the quality of the data therein, but also by the assumptions made when querying the database. A close look at the data and projections for Saudi Arabia in the WEO reveals a rather spotty effort, providing neither a clear picture of what is happening in this important region nor much confidence that the overall report for the world is accurate.
They're Still the One
Throughout the 2008 WEO, Saudi Arabia is cast in a leading role -- both figuratively:
On present trends, just to replace the oil reserves that will be exhausted and to meet the growth in demand, between now and 2030 we will need 64 mb/d of new oil-production capacity, six times the size of Saudi Arabia’s capacity today.
(from the Forward and Executive Summary)
and literally:
Saudi Arabia remains the world’s largest producer throughout the projection period, its output climbing from 10.2 mb/d in 2007 to 15.6 mb/d in 2030.
(Executive Summary, page 40)
Currently, Saudi Arabia produces over 10 percent of the world's crude oil (with the Ghawar oilfield alone producing 7 percent) and is the largest exporter. If all imminent and pending Saudi Aramco development projects come online as planned, one half of the ten most productive oilfields will be in Saudi Arabia (Ghawar, Safaniyah, Khurais, Manifa, and Shaybah). Consequently, it would seem desirable to get the Saudi picture correct. This is of course hindered by the reluctance of Saudi Aramco to make their data available, but the sheer size of the production and the remaining reserves means that large uncertainties in either of these translate into similarly large uncertainties for the world outlook.
Averaging the Unaveragable
By analyzing all of the world's resources collectively, it is hoped that such uncertainties will tend to average out. Unfortunately, Saudi fields and Ghawar in particular are true outliers. They are unique geologically, with a large volume of oil trapped in relatively few yet accessible reservoirs; politically, in that production is and has been under monolithic control; and economically, as the size of the resource relative to internal consumption has up to now allowed for a more measured depletion than has occurred elsewhere. In some sense, what happens in Saudi Arabia stays in Saudi Arabia, and the value of conflating trends with the rest of the world is dubious. It is perhaps questionable doing this for the other different oil producing regions as well.
The Elephant in the Report
Every analysis of Saudi Arabian oil should begin and end with Ghawar. Matt Simmons covered Ghawar thoroughly in the book "Twilight in the Desert", questioning many of the reassurances of Saudi Aramco about the future of the field. The Oil Drum (Stuart Staniford, Euan Mearns) has probed further into the state of the field, showing that it is possible to assess the resource independently using published information. Subsequently, I have shown that it is possible to independently monitor depletion mitigation efforts in Ghawar using satellite images (see these stories on The Oil Drum and Satellite o'er the Desert). One particular result of such studies relevant to the question of remaining reserves is an improved estimate the area of the field, necessary for an estimation of oil initially in place (OIIP). For Ghawar, a value of approximately 193 billion barrels was determined. The assumptions and method for this determination are given in Appendix 1 at the end.
The 2008 WEO mentions Ghawar often, but there is little new information presented. The 2005 release of the WEO had a specific focus on Middle East oil, and both the 2005 and 2008 releases of the World Energy Outlook have close-up looks at the Ghawar oil field. In fact, much of the Ghawar content from the former was copied and pasted verbatim in the new IEA 2008 report (with notable differences which are rather interesting). Both versions stumble right out of the gate with the same geographical error:
The area of the field — more accurately described as a collection of oil-bearing formations — is partitioned into six geographical areas, from north to south: Ain Dar, Shedgum, Farzan, Hawiyah, Uthmaniyah and Haradh.
As shown in the map below, the above listing of geographical areas is somewhat random rather than strictly north to south:

This is perhaps a minor (repeated) mistake, somewhat irrelevant to the goal of predicting future oil flows, but it indicates a certain level of carelessness with regards to the information presented. And as will be seen, the numerical data follow this theme. From 2005:
Ghawar is a large anticline structure, 280 km long by 25 km wide, with about 50 metres of net oil pay. Initial oil in place is believed to amount to at least 300 billion barrels. Cumulative production is 61 billion barrels and, according to Saudi Aramco, remaining proven reserves are about 65 billion barrels. Saudi Aramco has not provided sufficient data for a proper assessment, but the recovery rate could be between 40% and 60%.
and the corresponding text from 2008:
Ghawar is a large anticline structure, 280 km long by 25 km wide, with about 50 metres of net oil pay. Initial oil in place is 250 billion barrels, of which initial recoverable reserves are estimated at 140 billion barrels (implying an expected ultimate recovery rate of 56%). Cumulative production reached 66 billion barrels in 2007, so remaining reserves are about 74 billion barrels.
According to these reports, in three years time, Ghawar has lost "at least" fifty billion barrels of oil originally in place (OIIP), yet it seemingly has accrued nine billion barrels more in reserves -- and add to that the 5-6 billion barrels produced over that time. Reserves is the amount of the OIIP which is estimated to be economically extractable, and this can increase over time as technology improves or the price of oil changes. In this case, however, we also have an unexplained decrease in the OIIP.
Where did the 2005 number come from? The WEO suggests that most of the data came from the IHS database, although published accounts suggest that the IHS figure for 2005 was 210 billion barrels (Laharrere, 2005). It is probable that the 2005 WEO number does not originate with IHS but elsewhere. An indication of a possible source for the OIIP is the APS Review Gas Market Trends from October 2005, which has the following snippets:
Ghawar is the largest axis of fields in the world and is the main producer of Arab Light crude oil in Saudi Arabia. It is 250 km long and 15 km wide. It contains several fields, of which eight are major oil producers, and huge fields of natural gas in a Khuff reservoir deep beneath the oil formations (Fms). Ghawar's recoverable crude oil reserves exceed 70 bn barrels. Oil in place in the Ghawar region is estimated to be over 300 bn barrels.
...
The Ghawar fields are now producing close to capacity, with the output being AL crude oil. The other Ghawar fields producing this grade are Khurais, Harmaliya and Abu Hadriya.
The scope of misinformation in the above is too vast to address here, but the "over 300 billion" figure is strangely familiar. It seems possible that, in the least, the above document and the 2005 WEO have a common source for this value. Along that line, Saudi Aramco quotes a reserves value for Khurais of 27 billion barrels, so perhaps the extra 50 billion is accounted for by the Khurais OIIP. But beyond this forensic trivia, the more important point is that the value of 250 billion for Ghawar is still much higher than what appears to be in the IHS database (unless their estimate for Ghawar has been abruptly increased) and is much larger than is obtained (193 Gb) using the best available public information (see Appendix 1).
A Wrong Turn
A final revealing clue in this autopsy is revealed in a sentence at the end of the Ghawar segment:
Reports suggest that enhanced oil recovery techniques are being used to boost capacity in the mature zones of the Shedgum and Uthmaniyah areas, where extensive drilling programmes have recently been undertaken (Source: Sanford Bernstein, 2007).
The "reports" are two documents released by Bernstein and Associates which described investigations of Ghawar using satellite imagery. Unfortunately, as detailed here and here, the work contained major flaws, including the misidentification of rock outcroppings and electrical transmission towers for oil wells and an erroneous placement of the Ghawar field in the images. There is no evidence - or statements from Saudi Aramco - that anything other than continued peripheral water injection (plus infill drilling and workovers) is being used to coax oil from Shedgum. That the IEA analyst relied on the Bernstein work is not a positive development.
Whither Ghawar Decline?
While the WEO quotes a figure of 5.1 mb/d for current (2007) Ghawar production, there is no estimate provided for future levels. Indeed, Ghawar is still in the "plateau" stage according to the WEO criteria. It is not clear what decline rate rate for Ghawar, if any, was use to predict future Saudi production levels. There is acknowledgement, however, that decline is occuring:
The most recent project, involving the Haradh area in the southern part of the field, was completed in 2006, tripling capacity there to about 900 kb/d. This has helped to offset natural declines in other parts of the field. The overall capacity of Ghawar is sustained by infill drilling and well work-overs to maintain flow pressure in various parts of the field.
Thus, with no areas of Ghawar left to re-develop, maintaining current production levels will become more challenging.
Saudi Oil Beyond Ghawar
The 2008 WEO has many non-Ghawar references to Saudi Arabia oil, but the data is usually combined with other countries as well:
There are 101 upstream oil projects currently under development and planned in OPEC countries as a whole, involving an estimated 48 billion barrels of proven and probable reserves. Of these projects, 56 are onshore, involving about 28 billion barrels of reserves. The largest element of new production is due to come from Saudi Arabia, which will bring four new onshore fields into production.
(p. 273)
First, there are the pending onshore projects:
Saudi Arabia will continue to play a vital role in balancing the global oil market. Its willingness to make timely investments in oil-production capacity will be a key determinant of future price trends. Five major onshore projects, Khurais, Khursaniyah, Hawiyah, Shaybah and Nuayyim, which collectively hold 13 billion barrels of reserves, are all in the final phases of development and are projected to provide a total gross capacity addition of close to 3 mb/d by 2015.
(p. 274)
There are a few problems with the above excerpt, the first being the total reserves. If Khurais has roughly 27 billion barrels of reserves (as per Saudi Aramco), than the other four in that list have negative 14 billion. Next, we have Hawiyah (part of Ghawar) listed as a separate development project, which is not the case; it is being re-developed similarly to the rest of Ghawar. The Hawiyah NGL plant was completed recently, but it's not clear how NGL reserves are computed in Saudi Arabia by IEA. As for oil, Hawiyah by itself probably has 13 billion barrels remaining.
For production rates, we consider the described addition of "close to 3 mb/d by 2015". The following capacities can be found from many sources including Saudi Aramco :
| Project | Type | mb/d |
|---|---|---|
| Khurais | oil | 1.2 |
| Khurais | NGL | 0.07 |
| Khursaniyah | oil | 0.5 |
| Khursaniyah | NGL | 0.3 |
| Shaybah Phase II | oil | 0.25 |
| Nuayyim | oil | 0.1 |
| Hawiyah | NGL | 0.3 |
This adds up to 2.72 mb/d, which perhaps could be rounded up to 3. But clearly distinguishing between crude and NGL would seem to be a good idea here.
There is one offshore project in the works: the re-development of the Manifa field, although its delay for economic reasons seems likely:
Over the next five to six years, 45 offshore projects are either under development or firmly planned in OPEC countries, totalling 20 billion barrels. The largest project by far is the Manifa field in Saudi Arabia, accounting for one-quarter of these reserves. This field is expected to come on line in 2012 and will produce close to 1 mb/d when the plateau is reached about three years later.
(p. 274)
The Manifa output probably includes NGL, but only about 65 kb/d is expected to arise from that contribution. There might be some redevelopment of other offshore fields, but it is not clear how much (if any) additional IEA assumes there will through 2030 -- although the ramblings of Saudi Oil Minister Al-Naimi have been referenced:
Expansions of the Zuluf, Safaniyah and Berri fields could give further momentum to Saudi Arabian production.
(a footnote references Saudi Oil Minister Al-Naimi's comments at the Jeddah Summit on June 22, 2008)
So up to 2015, there is an addition of 4 mb/d oil + NGL to existing Saudi production (after being rather generous in rounding) from current projects. There are also many discovered but undeveloped fields remaining, although these are much smaller than those currently producing. Such development would also likely occur after 2015:
There are more than 100 onshore fields awaiting development, each holding more than 100 million barrels and with combined reserves of more than 50 billion barrels. The bulk of them are in just three countries: Saudi Arabia, Iran and Iraq. Two-thirds of those reserves are concentrated in about 30 giant fields (each holding more than 500 million barrels), including Sharar, Niban, Jaladi, Dhib and Lugfah fields in Saudi Arabia...
(p. 273-274)
Elsewhere, the report seems to give a figure for total Saudi reserves in undeveloped fields:
There are 6.2 billion barrels of reserves in 11 other known fields in Saudi Arabia that have yet to be developed — the highest in the world. Each of them holds reserves of at least 150 million barrels and the average is 450 million barrels.
Wait...11 fields times 450 million is 4.95 billion. Either the total reserves or the average is wrong, but it is difficult to surmise which without at least knowing which fields are included. One of these is offshore:
The largest known undeveloped field, Hasbah 1, holds 1.8 billion barrels. Part of the increase in gross capacity will be offset by the decline in capacity at existing fields. Saudi Arabia aims to maintain spare capacity in the range of 1.5 mb/d to 2 mb/d in the long term.
Production in 2015 and 2030
So, what differences are expected for Saudi oil production by 2015? Table 11.4 in the WEO gives a total liquids (crude plus NGL) value of 14.4 mb/d, which is a net addition of 4.2 mb/d from 2007. From above, we have the IEA additions of 3 mb/d from onshore and 1 mb/d from Manifa, totaling 4 mb/d. This leaves 200 kb/d unaccounted for, but more importantly, leaves little room to account for decline from existing production. Any assumed decline must be offset by a corresponding amount of new production in order to match the production predicted in the WEO. Several possible development projects are identified, but none of these are likely before 2015. If IEA has assumed new development in its analysis, they should provide specifics. And as with Ghawar, it is difficult to parse out exactly how much production growth is expected vs. how much decline. Net production is obviously the bottom line, but IEA should demonstrate that such predictions are backed by reasonable estimates.
For 2030, the WEO provides a more specific breakdown for total Saudi production (utilizing Figure 11.4): From 2007 to 2030, total liquids increases from 10.2 mb/d to 15.6 mb/d. About 3.5 mb/d of this increase is due to NGL, and 1.9 is due to crude oil. Furthermore, 1.2 mb/d of the added crude flow is attributed to enhanced oil recovery (EOR) efforts beyond 2015. Similarly to the prior period, any substantial gains in crude production due to new development must be offset by declines elsewhere, and the fate of growth potential for Saudi Arabia production lies with natural gas liquids.
CONCLUSION
The 2008 IEA World Energy Report urgently (and appropriately) recognizes the need for an assessment of future energy supplies based on a detailed accounting of the world's inventory. This need is not reflected in the data presented for the specific yet critical example of Saudi Arabia. Building and querying a database of the world's oilfields is good, but this is only of value if the underlying data is sound. Given the importance of Saudi Arabia's oil production, both from a practical and a symbolic standpoint, it is unfortunate that surprisingly little incremental effort was expended from WEO 2005 to WEO 2008 on conducting a truly original analysis of the situation for Saudi Arabia, especially given recent events. Furthermore, the aggregate data presented contains several glaring errors, casting further doubt on the quality of the raw data (assumed to be provided by IHS). IEA has clearly been hamstrung in its own efforts of painting an accurate energy picture, both in its available resources and in its access to the necessary data. It would be useful if IEA made available the raw data used for their work, thus allowing for additional analysis from the larger energy community. The focus on the world's oil future, and Saudi Arabia's in particular, needs to be sharpened.
.....................................................................
Appendix I: Estimating Ghawar OIIP
An important part of determining the cumulative amount of oil expected from a newly discovered field is to calculate the total amount of petroleum trapped within the geologic structure. This requires the following determinations:
- the area encompassing the field
- the thickness of the oil-bearing reservoir
- the porosity of the reservoir rock
- the percentage of the pore space occupied by water
- the change in volume for the petroleum upon being brought to the surface
The overall calculation is then:
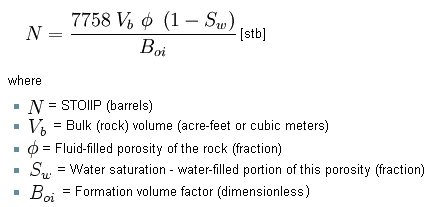
In a simple approximation, the bulk rock volume will be the area of the field times the average reservoir thickness.
Saudi Aramco keeps most of its data regarding Ghawar under wraps, but quite a bit is known from reports prepared before Saudi oil was fully nationalized. Many of the parameters are available from the Greg Croft website as well as in "Twilight in the Desert".
It is also necessary to estimate the areas for each of the Ghawar regions. These were computed from the field original oil-water contact (OOWC) locations determined using Google Earth. As a first approximation, the OOWC location can be assumed to lie under the curve connecting all the peripheral water injector wells. With the use of several maps showing the OOWC location relative to oil wells in the center of the field, however, it is possible to locate the OOWC more precisely. From a Google Earth kml file containing the polygon descriptions for each of the Ghawar regions, areas are measured using an online tool which uses an algorithm described here. I have tested this approach by tracing the boundaries of several US states, and the deviation from published areas is less than 3%.
A Google Earth file containing the current field boundaries and areas measured for Ghawar can be found here.
The measured field areas and parameters obtained from Greg Croft, along with the OIIP results, are shown in the table below.
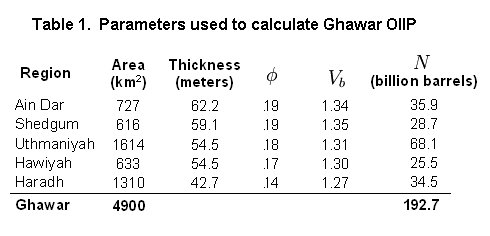
There is much uncertainty as to what the average oil layer thickness values in the above table refer to. Towards the edges of the field, the oil layer thins out, as shown below in a diagram (modified from Mearns).
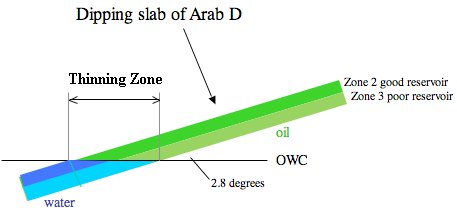
Specifically, if the stated thickness represents an average over the entire field (or region) including the edges, then a simple multiplication of the area by this average will yield the total volume of oil-bearing rock. Note, however, that the physical parameters of interest here, especially porosity, will vary both across the field by also vertically through the various reservoir zones. An accurate determination of OIIP requires the integration of oil content over all three dimensions.
From interpolated well core samples and more recent 3-D seismic investigations, Saudi Aramco clearly has more accurate numbers than from what is computed here, and given that there is no other way to check, it is worth comparing if available. The summed OIIP for the Ghawar regions of 'Ain Dar and Shedgum was reported by Baqi and Saleri of Saudi Aramco as being 68.1 billion barrels. The corresponding value obtained here is 64.6 billion barrels, an underestimate of about 5%. Extrapolating to the entire field would raise the OIIP to just over 200 billion barrels.


4 comments:
Dear Friends,
Although you will not read/hear about it for some years in the media, the top story of the year is that global crude oil production peaked in 2008.
The media, governments, world leaders, and public should focus on this issue.
Global crude oil production had been rising briskly until 2004, then plateaued for four years. Because oil producers were extracting at maximum effort to profit from high oil prices, this plateau is a clear indication of Peak Oil.
Then in July and August of 2008 while oil prices were still very high, global crude oil production fell nearly one million barrels per day, clear evidence of Peak Oil (See Rembrandt Koppelaar, Editor of "Oil Watch Monthly," December 2008, page 1) http://www.peakoil.nl/wp-content/uploads/2008/12/2008_december_oilwatch_monthly.pdf. Peak Oil is now.
Credit for accurate Peak Oil predictions (within a few years) goes to the following (projected year for peak given in parentheses):
* Association for the Study of Peak Oil (2007)
* Rembrandt Koppelaar, Editor of “Oil Watch Monthly” (2008)
* Tony Eriksen, Oil stock analyst and Samuel Foucher, oil analyst (2008)
* Matthew Simmons, Energy investment banker, (2007)
* T. Boone Pickens, Oil and gas investor (2007)
* U.S. Army Corps of Engineers (2005)
* Kenneth S. Deffeyes, Princeton professor and retired shell geologist (2005)
* Sam Sam Bakhtiari, Retired Iranian National Oil Company geologist (2005)
* Chris Skrebowski, Editor of “Petroleum Review” (2010)
* Sadad Al Husseini, former head of production and exploration, Saudi Aramco (2008)
* Energy Watch Group in Germany (2006)
Oil production will now begin to decline terminally.
Within a year or two, it is likely that oil prices will skyrocket as supply falls below demand. OPEC cuts could exacerbate the gap between supply and demand and drive prices even higher.
Independent studies indicate that global crude oil production will now decline from 74 million barrels per day to 60 million barrels per day by 2015. During the same time, demand will increase. Oil supplies will be even tighter for the U.S. As oil producing nations consume more and more oil domestically they will export less and less. Because demand is high in China, India, the Middle East, and other oil producing nations, once global oil production begins to decline, demand will always be higher than supply. And since the U.S. represents one fourth of global oil demand, whatever oil we conserve will be consumed elsewhere. Thus, conservation in the U.S. will not slow oil depletion rates significantly.
Alternatives will not even begin to fill the gap. There is no plan nor capital for a so-called electric economy. And most alternatives yield electric power, but we need liquid fuels for tractors/combines, 18 wheel trucks, trains, ships, and mining equipment. The independent scientists of the Energy Watch Group conclude in a 2007 report titled: “Peak Oil Could Trigger Meltdown of Society:”
"By 2020, and even more by 2030, global oil supply will be dramatically lower. This will create a supply gap which can hardly be closed by growing contributions from other fossil, nuclear or alternative energy sources in this time frame."
With increasing costs for gasoline and diesel, along with declining taxes and declining gasoline tax revenues, states and local governments will eventually have to cut staff and curtail highway maintenance. Eventually, gasoline stations will close, and state and local highway workers won’t be able to get to work. We are facing the collapse of the highways that depend on diesel and gasoline powered trucks for bridge maintenance, culvert cleaning to avoid road washouts, snow plowing, and roadbed and surface repair. When the highways fail, so will the power grid, as highways carry the parts, large transformers, steel for pylons, and high tension cables from great distances. With the highways out, there will be no food coming from far away, and without the power grid virtually nothing modern works, including home heating, pumping of gasoline and diesel, airports, communications, and automated building systems.
It is time to focus on Peak Oil preparation and surviving Peak Oil.
http://survivingpeakoil.blogspot.com/
http://www.peakoilassociates.com/POAnalysis.html
Thank you for all the hard work and careful analysis that went into this and your earier posts, I (and I'm sure many others) really appreciate this effort.
Fantastic work. Thanks for the careful and thorough work that went into this analysis. I'm re-reading the post for the third time.
Paul M.
Greaat reading your blog
Post a Comment